


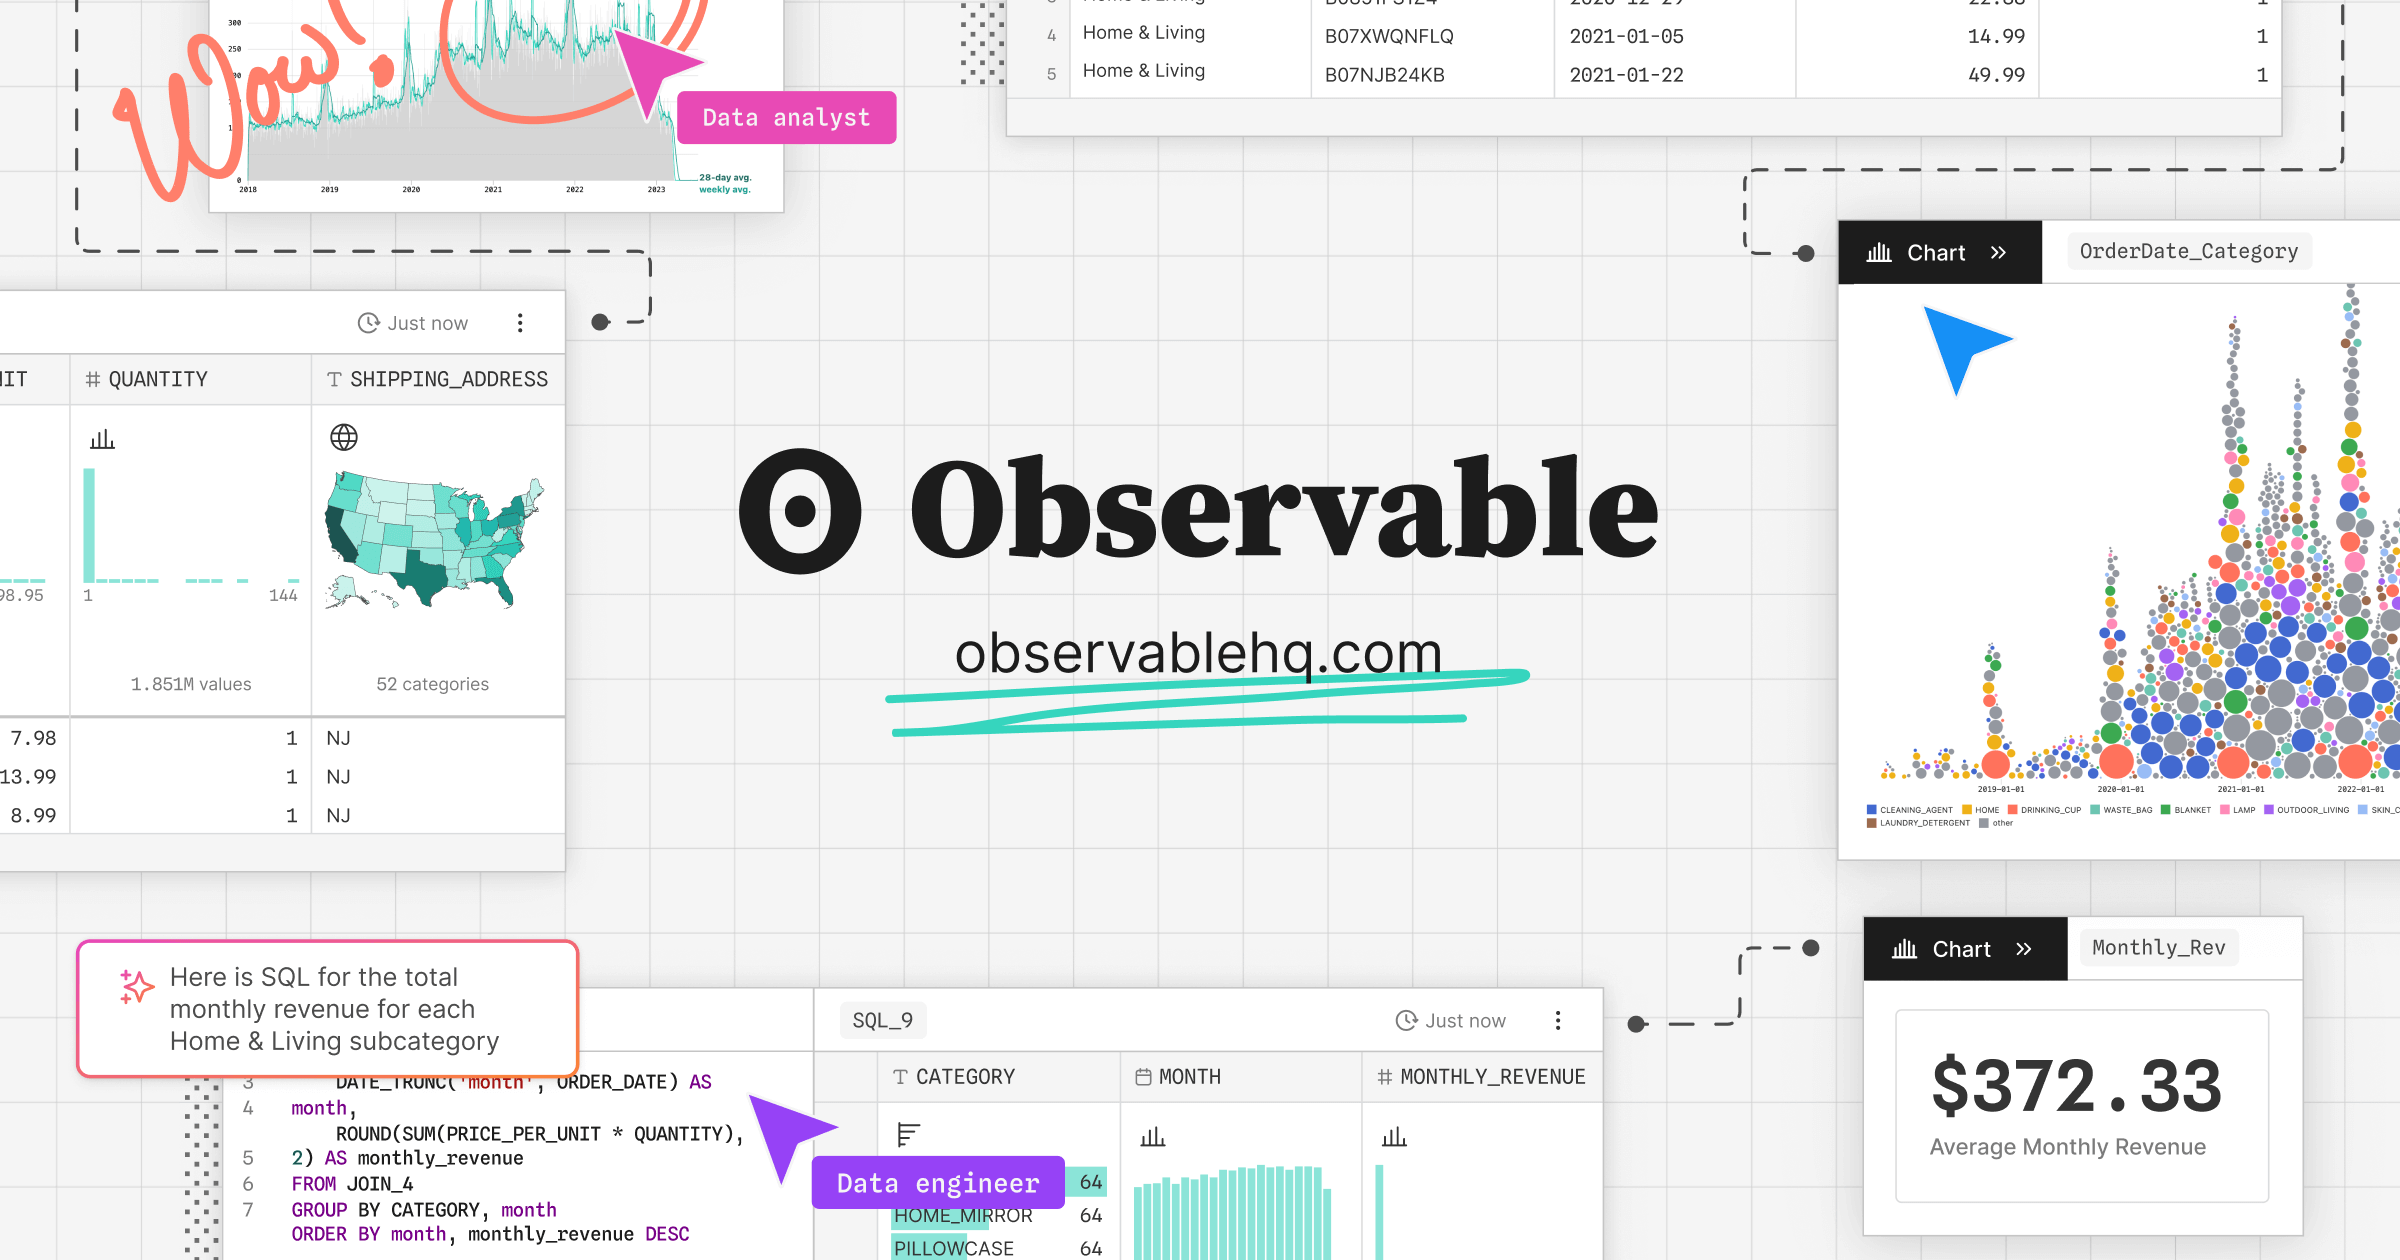
The best dashboards are built with code.
Observable is the modern platform for developing and hosting powerful, performant, polyglot data products built on open source.
Posit
The best data science is open source. Posit is committed to creating incredible open-source tools for individuals, teams, and enterprises.

High-performance JavaScript graph visualization for your data analytics products
Ogma is a commercial JavaScript library that can be leveraged to develop powerful, large-scale interactive graph visualizations. Ogma comes equipped with everything you need to easily visualize and analyze your graph data and increase your productivity across the board.
Beautiful data visualizations to stunning data apps with AI
Discover data applications for production with Plotly Dash. Put data and AI into action with scalable, interactive data apps for your organization.
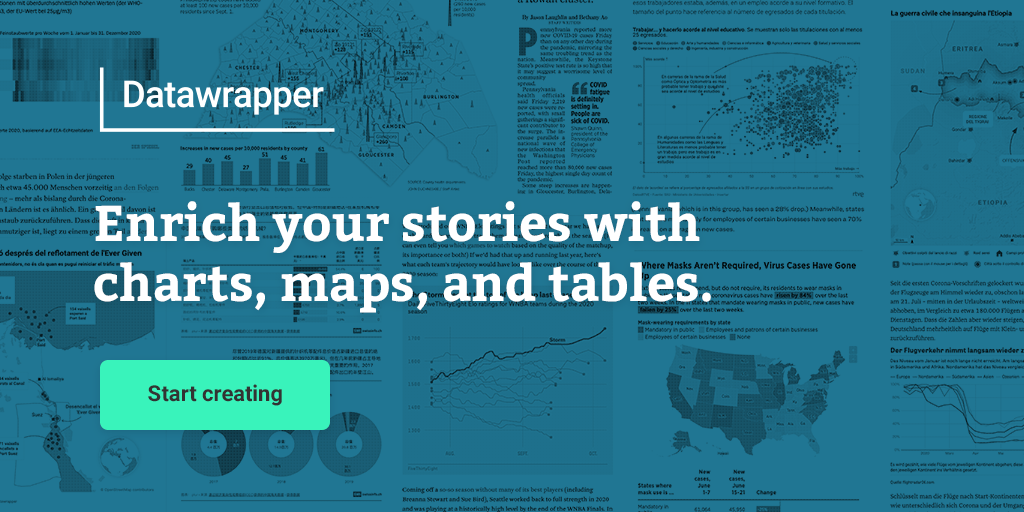
Datawrapper
Create interactive, responsive & beautiful data visualizations with the online tool Datawrapper — no code required.

Flourish Studio
Bring data to life with Flourish. Create data visualizations and interactive content – no coding needed. Engage, inspire, and tell your best data stories with ease.


Supercharged React dataviz components.
nivo provides a rich set of dataviz components, built on top of D3 and React.